The Playbook
A video series. Each episode takes real market data and one routine, and measures every event the same way — so the second is read against the first in numbers, not from memory.
Episodes
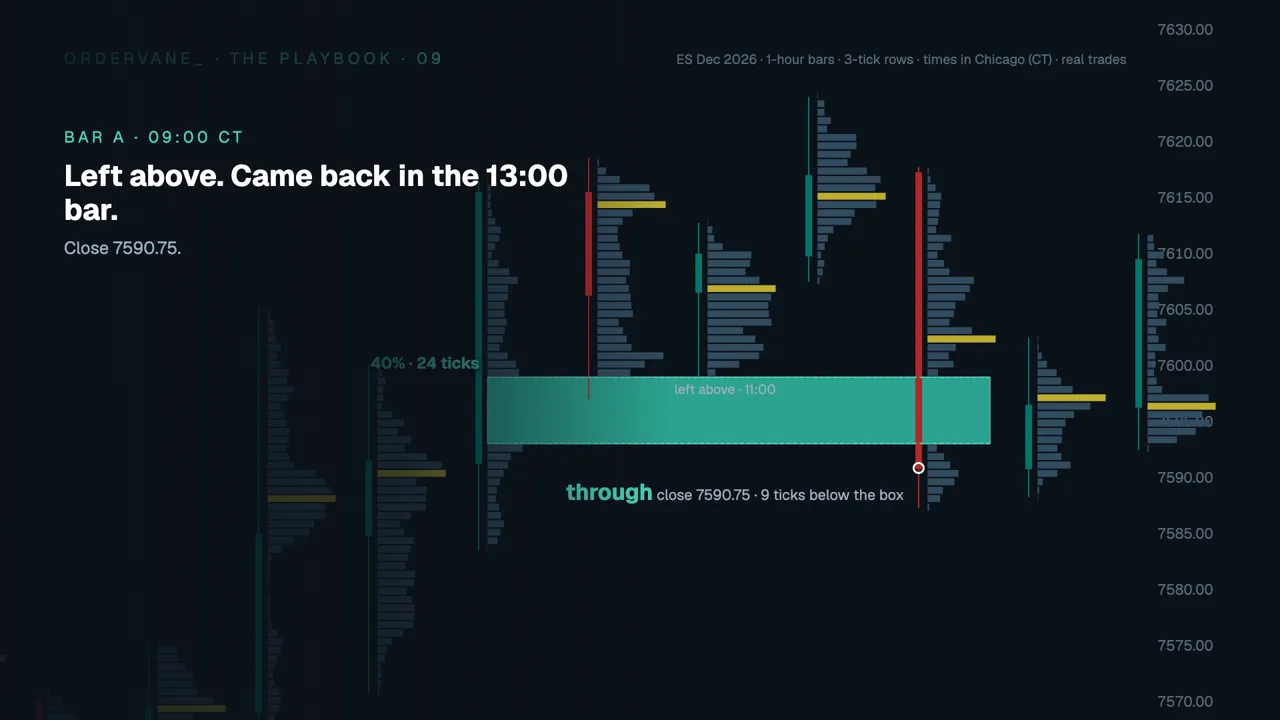 THE PLAYBOOK · 09 · 3 Nov 2026 · 6 minValue area: 40% vs 70%A bar's value area can be drawn at 70% or at 40%. This episode builds both boxes on the same bars of one ES day and measures every return the same way: the same return read through at 40% and inside at 70%. Over 23 days the share that held was about the same, and a box in the middle of the bar, with no volume in it, held about as often.The routine: OrderVane Pro
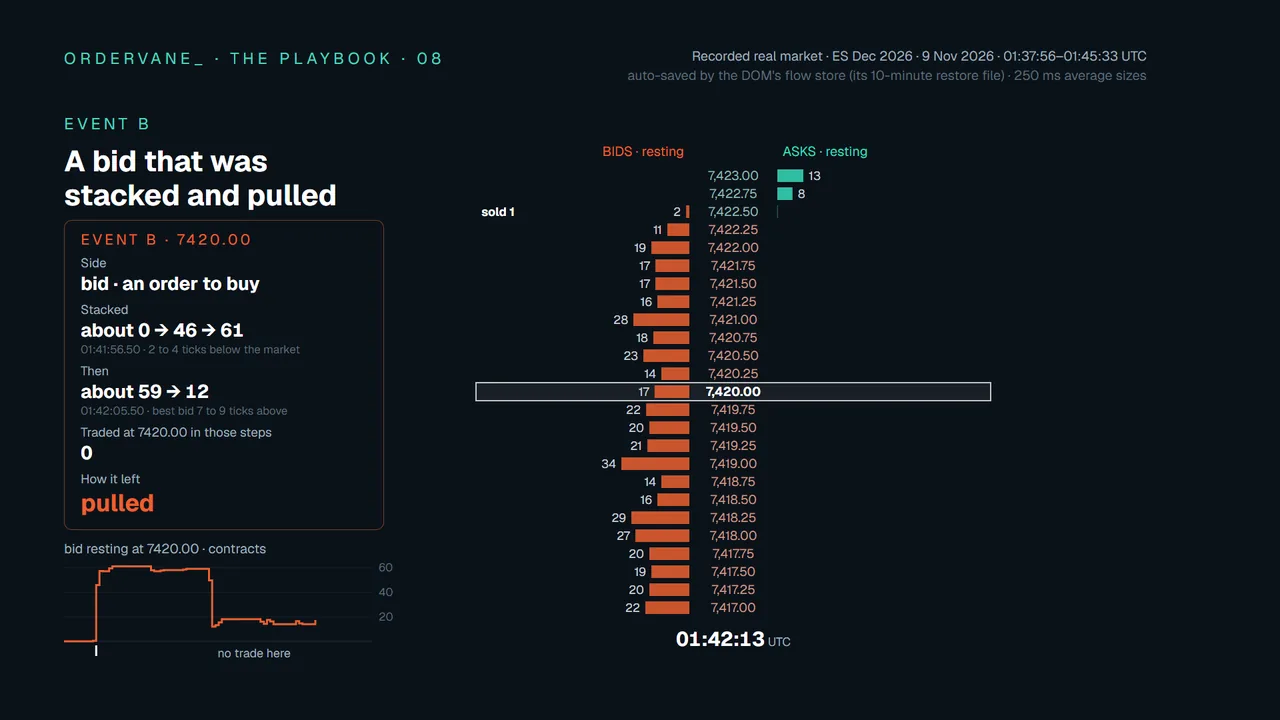 THE PLAYBOOK · 08 · 9 Nov 2026 · 6 minTaken or pulledOn a plain ladder, a big number that gets small looks the same whether it was traded or pulled. This episode takes one price on ES, 7420.00, where resting size left the book twice in about 18 seconds, and measures both the same way. Only the trade record tells them apart; it does not say where price goes next.The routine: OrderVane DOM
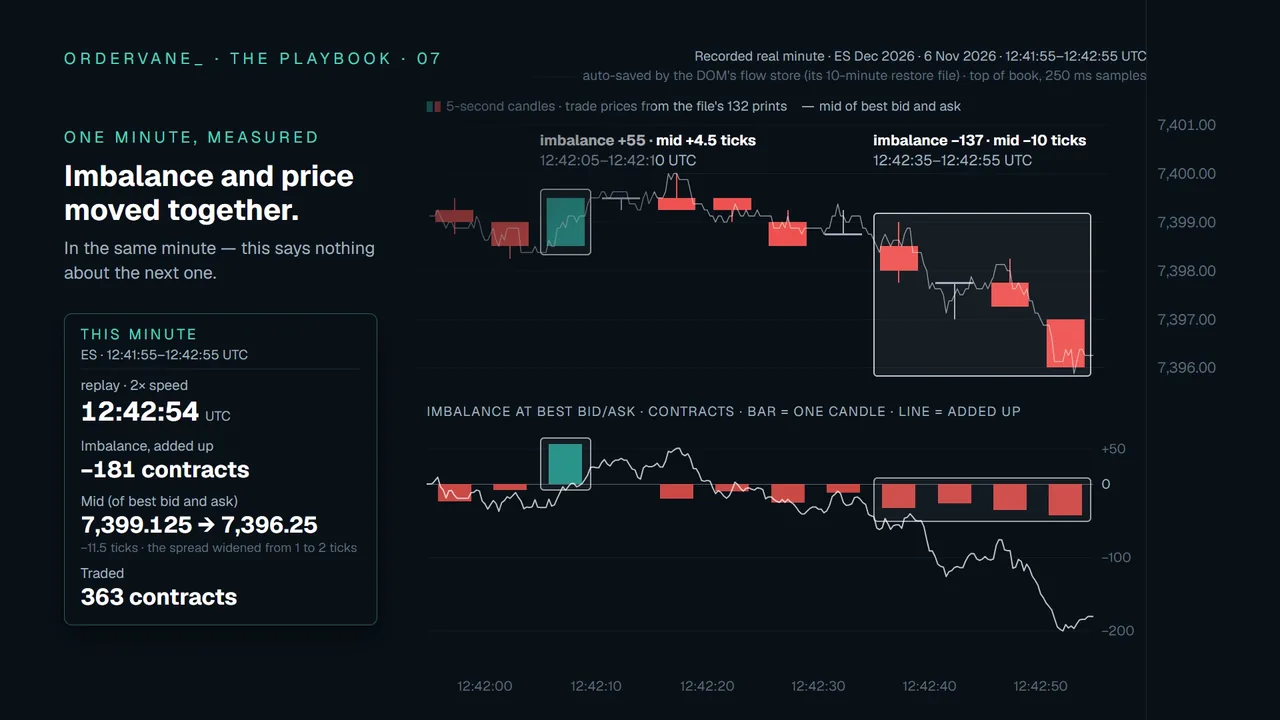 THE PLAYBOOK · 07 · 6 Nov 2026 · 7 minWatch the change, not the sizeResting size on a ladder can be added and pulled in a flash. This episode counts the change instead: size added minus size pulled, and at the best bid and ask the same idea researchers call order flow imbalance. In that minute, imbalance and price moved together; it says nothing about the next one.The routine: OrderVane DOM
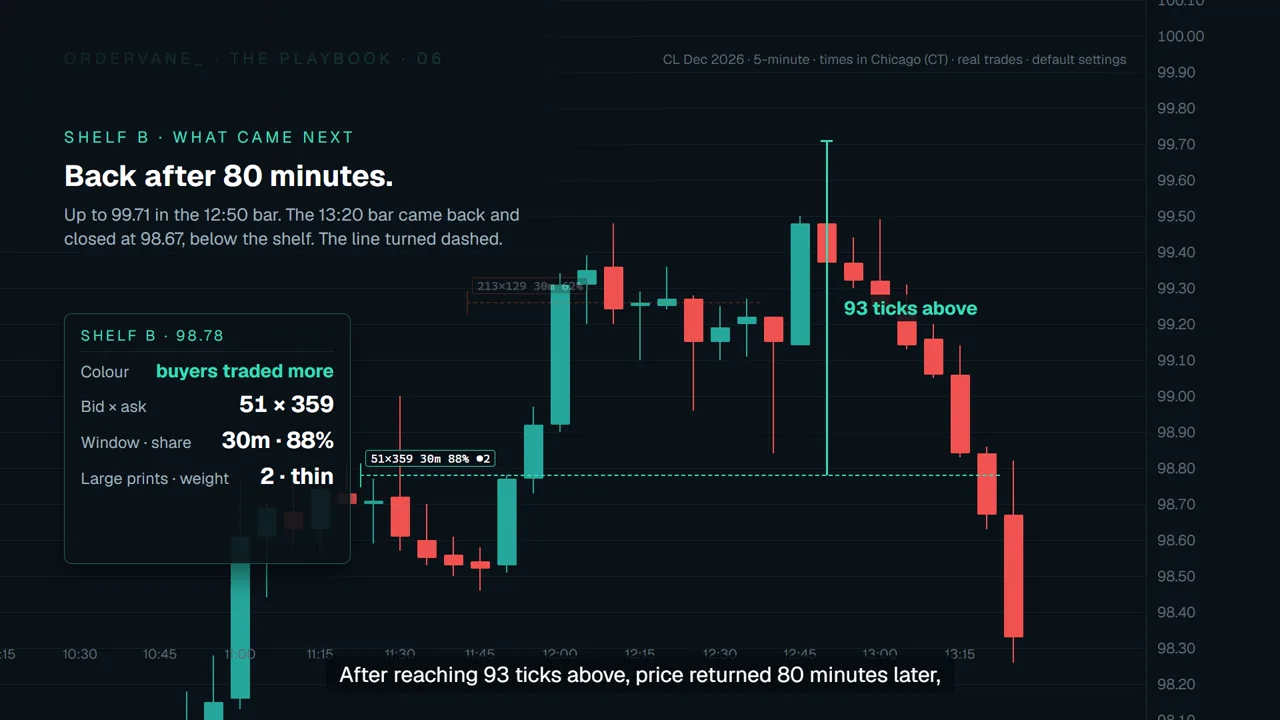 THE PLAYBOOK · 06 · 19 Oct 2026 · 7 minVolume shelvesTwo shelves on the same day, built the same way. Both are measured the same way: contracts, times the window's average, buyers and sellers, then whether price came back before the session ended.The routine: Volume shelf
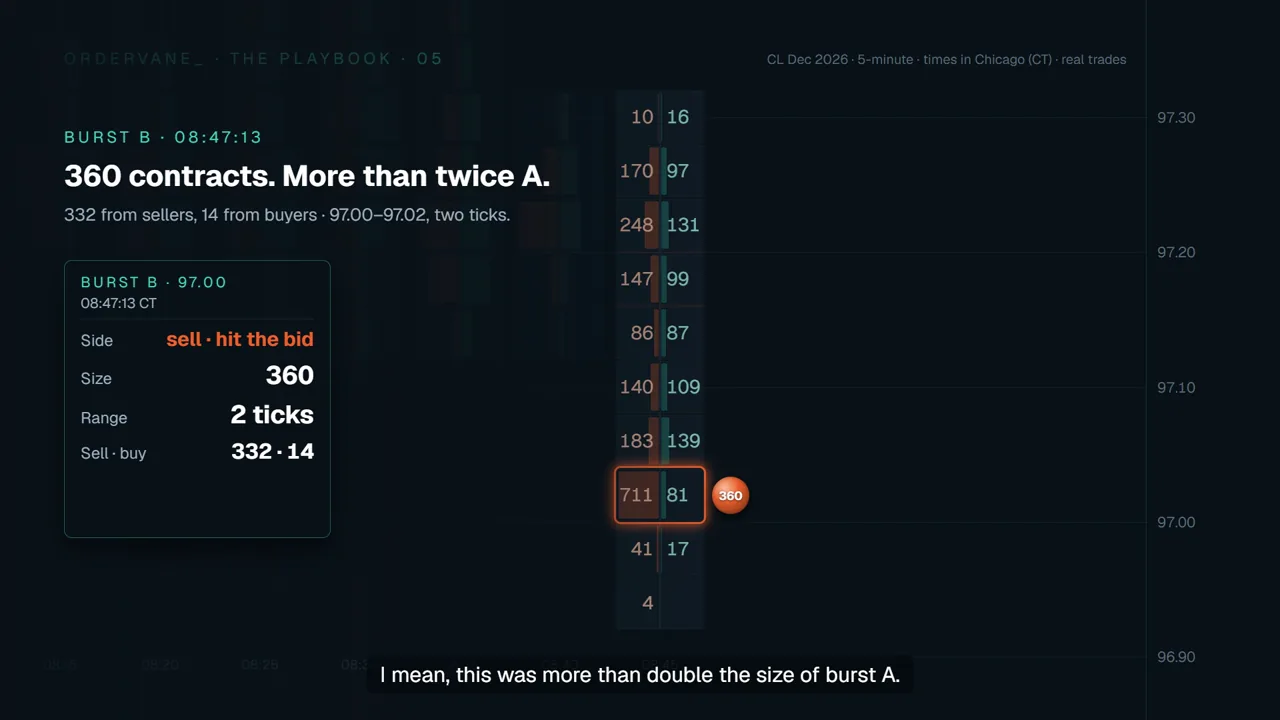 THE PLAYBOOK · 05 · 21 Oct 2026 · 8 minBig tradesOne large order fills as dozens of small prints. Both bursts are measured the same way: side, size, price range and each side's contracts, then what price did in the next five minutes.The routine: Big trade markers
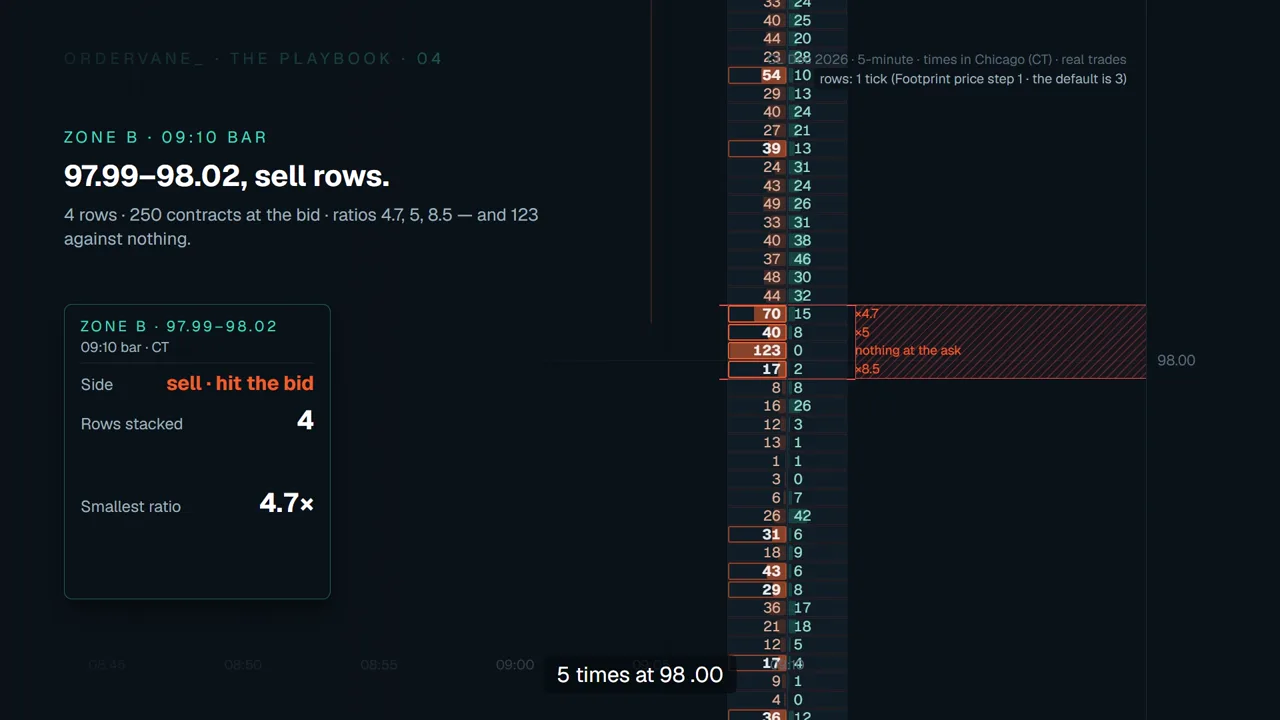 THE PLAYBOOK · 04 · 20 Oct 2026 · 8 minStacked imbalanceThree sell rows deep and four sell rows deep, on the same morning. Both zones are measured the same way: side, rows, volume and ratios, then when price traded through them.The routine: Stacked imbalance zones
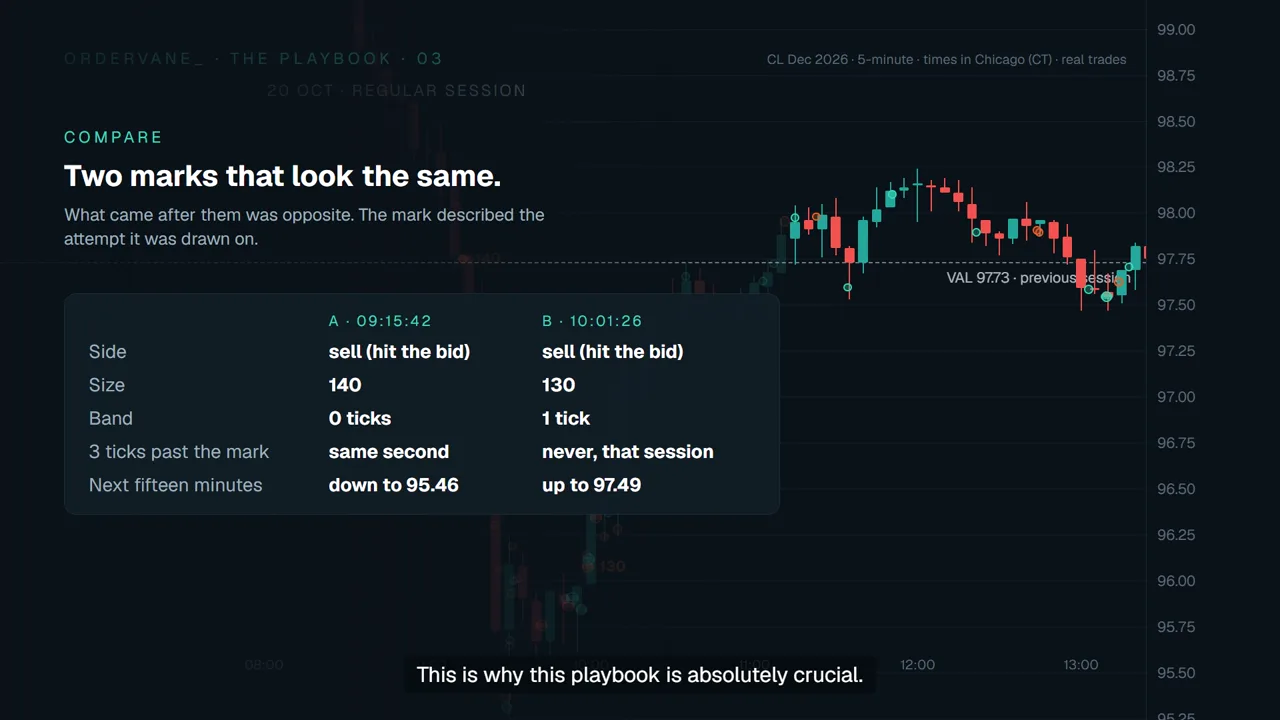 THE PLAYBOOK · 03 · 20 Oct 2026 · 8 minAbsorptionSize hit the book and price did not move, twice. Both marks are measured the same way: side, size, band and chunks, then what price did next.The routine: Absorption
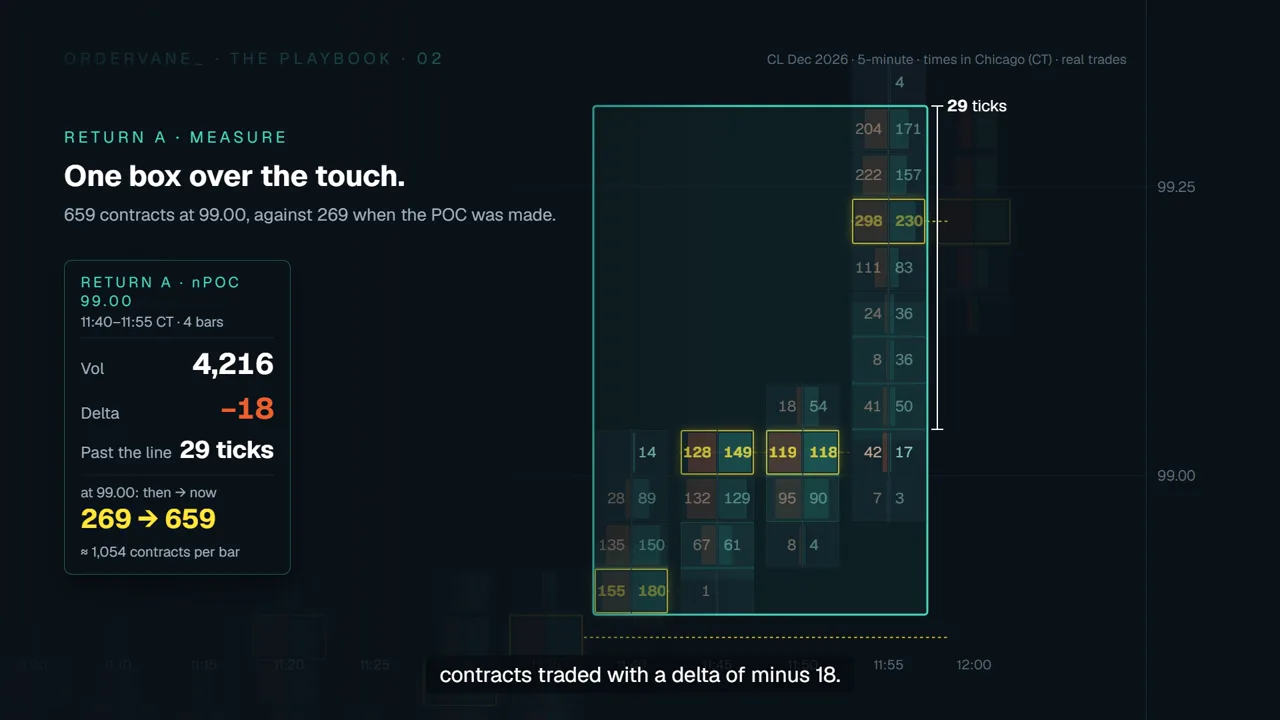 THE PLAYBOOK · 02 · 22 Oct 2026 · 8 minNaked POC returnsPrice came back to two bar POCs it had left hours earlier. Both returns are measured the same way: volume, delta, volume at the price then and now, and ticks past the line.The routine: Naked POC
 THE PLAYBOOK · 01 · 20 Oct 2026 · 8 minValue area edgesPrice came back to the previous session's value area low twice. Both touches are measured the same way: volume, delta, ticks past the line and big trades.The routine: Previous session's value area edges
How each episode is made
- Real market data, contract named on screen. Episodes 01–06: the trades Quantower recorded for one CL futures day — 5-minute bars, Chicago time. Episode 07: one recorded ES minute — top of book in 250 ms samples, plus its trades. Episode 08: a recorded ES window of 7 minutes 37 seconds — the average resting size at each price every 250 ms, plus its trades. Episode 09: the trades Quantower recorded for one ES day — 1-hour bars, Chicago time — then 23 days counted the same way.
- One routine, written down first. Each episode follows a routine written down before the video; episodes 01–06 are also on docs pages, step by step.
- The same numbers every time. Each event is measured the same way — in episodes 01–06 with one box: volume, delta, and the routine's own measures.
- Narration. AI-generated (Google NotebookLM) from a source document we wrote; every number in it is checked against the data.
These numbers describe what already happened. They are not a forecast, a probability or a trading signal.
New episodes are posted on YouTube and Instagram.
OrderVane Pro and OrderVane NT Pro draw the levels and the box measurement used in episodes 01–06 on Quantower and NinjaTrader 8 charts; OrderVane DOM has the Net Σ, Stack Σ and Pull Σ columns from episodes 07 and 08; OrderVane Pro also draws each bar's value area from episode 09.
See what it looks like · Lite $89 · Pro $129 · 14-day free trial